How it works
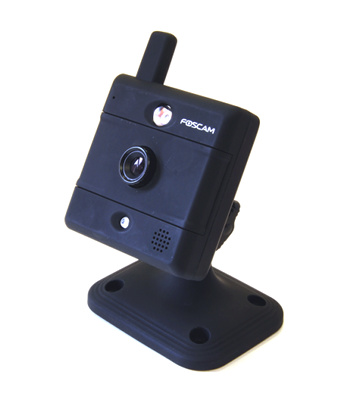
In a nutshell, the Photonic Instrument employs one of these IP cameras:-

FI8907W Foscam IP camera.
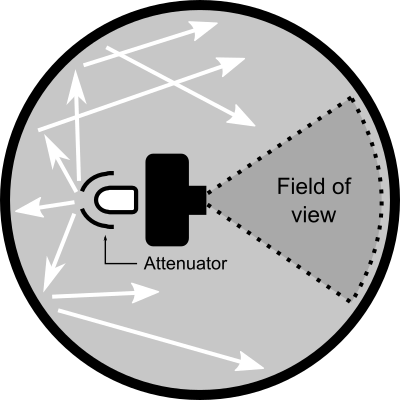
inside a windowless integrating sphere, dimly lit with a white LED arranged like this behind the camera:-

Inside the integrating sphere.
to produce noisy images that look like this:-

Exactly what the camera sees.
The web cam is at the centre of an integrating sphere. The sphere inside diameter is 260mm. This is the de rigour scientific approach to guaranteeing very uniform lighting for optical instrument testing. The web cam (actually it’s focal plane) is at the centre of the sphere, looking at the inside surface. Directly behind the camera and facing in the opposite direction is a white LED. The LED lights up the inside of the sphere, and as the light reflects in all directions and many times, a uniform illumination develops. The sphere coating is not a perfect Lambertian surface but works remarkably well for domestic emulsion paint. Needless to say, the front automatic infra red illuminator has been disabled as well as the network status and power LEDs on the rear of the camera.
As the uniform light enters the web cam, it forms a grey image. The intensity of this image is determined by the level of illumination, and the degree of automatic gain as the camera tries to bring the image up to a reasonable viewing level. The LED orientation has been chosen carefully to facilitate a minimum of two bounces for any light rays before entering the camera lens. This is important for uniformity within an integrating sphere. The current to the LED is controlled by an external series resistor and its value is subject to experimentation. There is also an attenuator covering the LED. This allows the LED to be driven at a sufficiently high level to ensure full spectrum output. The aim is to reduce the LED level to below the point that can be compensated out by the automatic image gain of the camera’s signal processor. This minimum illumination level will maximise image noise and therefore entropy. A major obstacle is that the web cam automatically cuts out and blanks the image if the image level is too low. The trick is to set the image intensity to just above the cut off point for maximum noise generation.
There is also a light dependant resistor (ORP12 type) mounted on the rear of the camera, as well as a digital thermometer. The ORP12 allows the light level inside the integrating sphere to be measured relatively accurately. A specific lux intensity is not required, as long as a resistance can be repetitively measured. The thermometer has been incorporated to monitor the temperature within the integrating sphere. This is important as noise levels vary with temperature, and we were concerned that the sphere would catch fire due to the power dissipation from the camera. We have estimated/measured a 7.5°C temperature rise due to the insulating effect of 20mm of polystyrene and a roughly 300mA @ 5V power dissipation. Both temperature and photo-resistance can be read externally.
And each image’s JPEG file is the entropy. It’s an extremely correlated bit fixing source, averaging ~21.4kB in size. Such a file’s entropy is conservatively assessed for cryptographic purposes at 21kb, and the instrument can produce 10 frames per second. If you exclude the overhead for entropy extraction, the Photonic Instrument creates about 210kb of entropy per second. It’s an extremely correlated bit fixing source, of size $\mu=19.46, \sigma = 0.161$ kB. Such a file’s entropy is exactly measured for cryptographic purposes at $4,373 \times 7.9 = 34,500$ kb, and the instrument can produce 10 frames per second. If you exclude the overhead for further entropy extraction, the Photonic Instrument creates about 345 kb of entropy per second.
Following entropy extraction to generate a 500 kB file of independent and identically distributed random bytes, the rudimentary ent program gives the following encouraging verdict:-
$python3 ./trng.py 500000 | ent
Entropy = 7.999640 bits per byte.

Optimum compression would reduce the size
of this 500000 byte file by 0 percent.

Chi square distribution for 500000 samples is 250.16, and randomly
would exceed this value 57.39 percent of the times.

Arithmetic mean value of data bytes is 127.3968 (127.5 = random).
Monte Carlo value for Pi is 3.144924580 (error 0.11 percent).
Serial correlation coefficient is 0.000307 (totally uncorrelated = 0.0).
The output also passes diehard but that doesn’t easily fit on this summary page. An interesting side note is that diehard,dieharder or the other standard randomness tests are superfluous. The SHA hash based nature of the randomness extractor guarantees a uniform distribution.